
Core idea
In dieser Unterrichtsreihe geht es darum Schülerinnen und Schülern (SuS) eine Vorstellung von maschinellem Lernen und Künstlicher Intelligenz zu vermitteln. Dies wird anhand von datenbasierten Entscheidungsbäumen erarbeitet. Die Umsetzung in dieser Reihe basiert hauptsächlich auf unplugged Materialien, die das handlungsorientierte Lernen auf enaktiver Ebene ermöglichen. Dies wird ergänzt durch eine digitale Lernumgebung, die zum Ende der Reihe flexibel einsetzbar ist. Der ausgewählte Kontext „Lebensmittel“ ist für alle SuS relevant und insbesondere auch für jüngere SuS geeignet.
Lebensmittel kann man anhand von Nährwertangaben als “eher empfehlenswert” oder “eher nicht empfehlenswert” klassifizieren. Dabei müssen mehrere Merkmale wie Fettgehalt, Zuckergehalt und Kalorien berücksichtigt werden. Ein mehrstufiges Regelsystem, mit dem solche Klassifikationen durchgeführt werden können, sind sogenannte Entscheidungsbäume (engl. decision trees). Solche Entscheidungsbäume kann man basierend auf Daten erstellen. Mit Daten ist hier gemeint: Man geht von einer Menge von Lebensmitteln aus, zu dem Nährwertangaben bekannt sind, und zu denen man weiß, ob sie eher empfehlenswert oder nicht empfehlenswert sind. Darauf aufbauend kann man “manuell” schrittweise Entscheidungsbäume erstellen, die die Lebensmittel zunehmend fehlerfreier klassifizieren. Dieser Erstellungsprozess kann auch automatisiert werden, um nach bestimmten Kriterien optimale Entscheidungsregeln zu finden. Die Automatisierung erfordert, jedes Lebensmittel als “Datenkarte” – das ist eine Liste von Zahlenwerten zu den verschiedenen Nährwertmerkmalen – digital zu repräsentieren. Ein maschinelles Lernverfahren entwickelt zu diesen Daten einen passenden (daten-basierten) Entscheidungsbaum. In der Praxis sind neben Entscheidungsbäumen auch andere Typen von Klassifikatoren – z.B. neuronale Netze – im Gebrauch, mit darauf angepassten maschinellen Lernverfahren.
Entscheidungsbäume haben den Vorteil, dass sie als Regelsystem von SuS verstanden werden können, ebenso können die Erstellungsverfahren eines Baumes zunächst manuell erarbeitet und dann am Computer automatisiert werden. Im Unterricht werden Lebensmittel zunächst als reale Datenkarten modellhaft repräsentiert und die SuS können Karten sortieren und klassifizieren, um sich auf einer enaktiven Ebene Verfahren anzueignen. Der Anspruch ist, einen Einblick “in den Maschinenraum” des maschinellen Lernens zu gewinnen und nicht nur vorgegebene Systeme, die eine völlige Black-Box bleiben, als Klassifikatoren mit Daten zu trainieren.
In dieser Unterrichtsreihe wird in ca. 9 Unterrichtsstunden in datenbasierte Entscheidungsbäume eingeführt. Dabei steht im Vordergrund, wie ein Entscheidungsbaum aufgebaut ist und wie die passenden Entscheidungsregeln datenbasiert hergeleitet werden. Dieser systematische, datenbasierte Erstellungsprozess kann dann als eine Methode des maschinellen Lernens automatisiert erfolgen und ein resultierender Entscheidungsbaum kann als eine Form künstlicher Intelligenz bezeichnet werden. Dazu erstellen SuS manuell mit Hilfe von Datenkarten eigene Entscheidungsbäume, um zu verstehen, erstens wie ein Entscheidungsbaum als Regelsystem aufgebaut ist, und zweitens wie man systematisch bei der Konstruktion vorgehen kann, um Entscheidungsbäume mit möglichst geringer Fehlklassifikationsanzahl zu erhalten. Ergänzend gibt es eine vorbereitete digitale Lernumgebung, in der SuS Entscheidungsbäume automatisiert erstellen können. Dabei lernen sie etwas über Künstliche Intelligenz und maschinelles Lernen. Sie lernen Entscheidungsbäume als gewinnbringende Repräsentation von Daten kennen, mit deren Hilfe Erkenntnisse gewonnen und Vorhersagen getroffen werden können, bei deren Anwendung aber auch Fehler passieren können.
Auf fachlicher Basis der deutschen Gesellschaft für Ernährung (DGE) wird das Thema Ernährung aufgegriffen, welches in der Sekundarstufe I behandelt werden sollte, aber aktuell in den Lehrplänen der verschiedenen Fächer unterrepräsentiert ist. Auf diese Weise wird das Thema maschinelles Lernen mit einem bildungsrelevanten Sachthema verknüpft. Der Kontext ist nicht typische für den Bereich KI und maschinelles Lernen, eignet sich aber für die Anbindung an die Erfahrungswelt aller SuS (unabhängig von Alter, Geschlecht, etc.). Es gibt dazu Verknüpfungsmöglichkeiten z. B. zum Biologieunterricht und die Behandlung des Kontextes kann einen Beitrag zu allgemeinbildendem Unterricht darstellen.
Target group
Informatik in Klasse 5 und 6 (alle Schulformen) – Anknüpfung an Biologie- und Mathematikunterricht möglich.
Empfehlung: Ab Klasse 6
Inhaltsfeld
“Künstliche Intelligenz und maschinelles Lernen” (insbesondere der Schwerpunkt: überwachtes Lernen mit Entscheidungsbäumen), “Daten und Information”
Prior knowledge
Basiskenntnisse über Nährwertangaben sind wünschenswert, entsprechende Erklärungen könnten aber auch in diesem Modul integriert werden
Time scope
8 to 10 lessons of 45 minutes each
Goals
Bezogen auf Datenkarten Entscheidungsbäume:
Die SuS…
- können einen Entscheidungsbaum als Regelsystem zum Klassifizieren von Objekten anwenden.
- verstehen eine Datenkarte als Repräsentation eines Objekts, auf dem die Ausprägungen verschiedener Merkmale dieses Objekts erfasst sind.
- erstellen Entscheidungsregeln zum Klassifizieren von Objekten hinsichtlich eines (Ziel-)Merkmals systematisch basierend auf Daten (in Form einer Sammlung von Datenkarten), d. h. basierend auf den Ausprägungen anderer (Prädiktor-)Merkmale der Objekte.
- präsentieren und reflektieren eigene Entscheidungsbäume angemessen.
- verstehen die Rolle von Daten als Grundlage für die Erstellung von Entscheidungsbäumen.
- verstehen, dass Entscheidungsbäume Prognosen liefern sollen (Klassifikationen neuer Objekte) und deshalb mit neuen Daten getestet werden müssen und dass dabei Fehler in Form falscher Prognosen auftreten können.
- bewerten Entscheidungsbäume anhand der Anzahl falsch klassifizierter Objekte in einem Datensatz.
- beschreiben anhand ihrer manuellen Erfahrungen mit Datenkarten, wie ein Computer Entscheidungsbäume automatisiert erstellen kann und identifizieren diesen Vorgang als maschinelles Lernen.
Bezogen auf den Inhalt Lebensmittel:
Die SuS…
- lernen die Bedeutung einzelner Nährwertangaben (Merkmale) bei Lebensmitteln und ihre Relevanz für die Qualitätsbewertung von Lebensmitteln kennen.
- leiten aus den gegebenen Nährwertdaten ein Regelsystem ab, das Prognosen darüber trifft , ob ein (neues) Lebensmittel eher empfehlenswert oder eher nicht empfehlenswert ist.
Leitfragen
- Wie kann man anhand der Nährwertangaben einen Entscheidungsbaum konstruieren, der die Beurteilung unterstützt, ob ein Lebensmittel eher empfehlenswert oder eher nicht empfehlenswert ist?
- Wie kann man einen Entscheidungsbaum für dieses Problem automatisiert (durch maschinelles Lernen) erstellen lassen?
Lesson overview
Part 1: Introduction to the context of AI and problematization
| Phase | Content | Material | |
|---|---|---|---|
|
1 |
|
Part 2: Excursus on food and recommended nutrition
| Phase | Content | Material | |
|---|---|---|---|
|
2 |
|
Part 3: Preparing the data: Providing data cards with labels
| Phase | Content | Material | |
|---|---|---|---|
|
3 |
|
Part 4: Introducing the concept of data and data-based decision rules
| Phase | Content | Material | |
|---|---|---|---|
|
4 |
|
Part 5: Creating good single-level trees
| Phase | Content | Material | |
|---|---|---|---|
|
5 |
|
Part 6: Creating multi-level decision trees
| Phase | Content | Material | |
|---|---|---|---|
|
6 |
|
Part 7: Using different decision trees to classify a new food map
| Phase | Content | Material | |
|---|---|---|---|
|
7 |
|
Part 8: Systematic testing of decision trees using multiple test cards
| Phase | Content | Material | |
|---|---|---|---|
|
8 |
|
Part 9: Automatic creation of decision trees with the computer and reflection on possible applications and limitations
| Phase | Content | Material | |
|---|---|---|---|
|
9 |
|
Evaluation
| Phase | Content | Material | |
|---|---|---|---|
|
|
|
Glossar
Ast Ein Ast innerhalb eines Entscheidungsbaums ist eine von mehreren Abzweigungen, die von einem Regelknoten zu einem nächsten Knoten führt.
Ausprägung/Merkmalsausprägung Die Werte, die ein Merkmal annehmen kann, nennt man Merkmalsausprägung.
Beispiel (im Kontext von KI) Ein Beispiel ist ein Objekt (z. B. Lebensmittel), das durch bestimmte Merkmale (z. B. Nährstoffe) beschrieben wird und mit einem Label (z. B. „eher empfehlenswert“ oder „eher nicht empfehlenswert“) versehen ist.
Blattknoten Ein Entscheidungsbaum besteht aus verschiedenen Knoten. Die Knoten am Ende eines Entscheidungsbaums nennt man Blattknoten und in ihnen ist immer eine Entscheidung für eine Ausprägung des Zielmerkmals eingetragen.
Datenkarte Eine Datenkarte repräsentiert ein Objekt, indem darauf die Ausprägungen einer Liste von Merkmalen dargestellt sind (z. B. ein Lebensmittel durch Nährwertangaben zu einer Liste von Nährstoffen). Eine Datenkarte kann digital oder analog repräsentiert sein.
data split Ein Datensplit ist die Aufteilung von Daten in Teildatensätze basierend auf den Ausprägungen eines Merkmals, z. B. durch einen Schwellenwert.
Entscheidungsbaum Ein Entscheidungsbaum ist ein (übersichtliches, in gewissen Grenzen nachvollziehbares) Regelsystem, das als Baumdiagramm dargestellt werden kann. Ein solcher Entscheidungsbaum veranschaulicht hierarchisch aufeinanderfolgende Entscheidungsregeln, an deren Ende immer eine Entscheidung für eine bestimmte Fragestellung steht.
misclassifications Eine Objekt, das durch einen Klassifikator einer falschen Klasse zugeordnet wird nennt man Fehlklassifikation.
Klasse (im Kontext von KI) Eine Klasse ist eine Ausprägung eines kategorialen Zielmerkmals beim überwachten maschinellen Lernen.
Klassifikation Mit einem Entscheidungsbaum kann man Ausprägungen eines (mit einer gewissen Wahrscheinlichkeit) Merkmals vorhersagen. Anders formuliert kann man also ein Objekt einer Klasse zuordnen. Eine solche regelgeleitete Zuordnung zu einer Klasse nennt man Klassifikation.
Klassifikator Ein Klassifikator ist ein Regelsystem (z. B. Entscheidungsbaum), das bestimmte Objekte anahand von Prädiktormerkmalen klassifizieren kann.
Klassifizieren Das Klassifizieren eines Objekts entspricht dem Zuordnen eines Objekts zu einer Klasse (aus einer Menge möglicher Klassen). Klassen können auch als Merkmalsausprägungen eines kategorialen Merkmals verstanden werden.
Künstliche Intelligenz (KI) Künstlicher Intelligenz befasst sich mit der Frage, wie man Computer dazu bringen kann, Dinge zu tun, die Menschen bisher besser beherrschen. Dazu gehören verschiedenste Anwendungen, u. A. die Fähigkeit in verschiedenen Szenarios Vorhersagen zu treffen oder Klassifikationen vorzunehmen die mit einer hohen Rate korrekt sind. Somit zählen leistungsfähige Klassifikatoren (z.B. Entscheidungsbäume) zu den Anwendungen von Künstlicher Intelligenz.
Label Ein Label gibt die Klassenzugehörigkeit eines Objekts an. Das Label kann als Ausprägung eines Merkmals (Zielmerkmal) verstanden werden.
Maschinelles Lernen Maschinelles Lernen bezeichnet Verfahren, in denen eine Lernaufgabe automatisiert durch Lernalgorithmen basierend auf Daten gelöst wird. Maschinelles Lernen unterscheidet verschiedene Arten von Lernaufgaben. Typischerweise wird zwischen drei Arten von Lernaufgaben unterschieden: überwachtes Lernen, unüberwachte Lernen und bestärkendes Lernen. Beim überwachten Lernen geht es darum, die Ausprägung eines Zielmerkmals für eine bestimmte Art von Objekten vorherzusagen. Beim unüberwachten Lernen geht es darum, Objekte anhand bestimmter Merkmale in Gruppen ähnlicher Objekte zusammenzufassen und beim bestärkenden Lernen geht es darum, sogenannte „Agenten“ (z.B. Roboter) zum Handeln zu bringen. Bei allen Lernaufgaben kommen unterschiedlichste Lernalgorithmen zum Einsatz.
Merkmal Merkmale charakterisieren Objekte und können verschiedene Ausprägungen annehmen. Es gibt numerische und kategoriale Merkmale.
Objekt Objekte sind Merkmalsträger jeglicher Art. D. h. Objekte können durch Merkmale beschrieben werden (Z. B. Lebensmittel werden durch Nährwerte beschrieben, Menschen durch charakterisierende Eigenschaften wie Haarfarbe oder Körpergröße). Dabei ist nicht festgelegt welche Merkmale zum beschreiben eines Objektes herangezogen werden.
Pfad Ein Pfad innerhalb eines Entscheidungsbaums ist eine Abfolge von Ästen, die im Wurzelknoten beginnt und in einem Blattknoten endet.
Prädiktormerkmal Beim überwachten maschinellen Lernen geht es darum für eine bestimmte Art von Objekten die Ausprägung eines Zielmerkmals vorherzusagen. Für die Vorhersage wird ein Regelsystem basierend auf weiteren Merkmalen erstellt. Diese weiteren Merkmale, auf denen also die Vorhersage beruht nennt man Prädiktormerkmale.
Regelknoten Ein Entscheidungsbaum besteht aus verschiedenen Knoten. Zu Beginn stehen immer Regelknoten, die anhand von Prädiktormerkmalen gebildete Entscheidungsregeln repräsentieren. Alle Knoten in einem Entscheidungsbaum, bis auf die jeweils letzten Knoten weines Pfades, sind Regelknoten.
threshold value Ein Schwellenwert ist eine Ausprägung, die zu einem numerischen Merkmal gewählt werden kann, um Objekte in Teildatensätze zu gruppieren. Die Teildatensätze ergeben sich aus den Objekten, deren jeweilige Ausprägung kleiner oder gleich dem Schwellenwert ist und denjenigen, deren jeweilige Ausprägung größer als der Schwellenwert ist.
Trainingsdaten Trainingsdaten sind ein Satz von Daten, die genutzt werden, um mit Hilfe von maschinellem Lernen einen Klassifikator (z. B. Entscheidungsbaum) zu erstellen.
test data Testdaten sind ein weiterer Satz von Daten, mit denen ein erstellter KLassifikator getestet wird. Trainings- und Testdaten sind disjunkt.
Zielmerkmal Beim überwachten maschinellen Lernen geht es darum für eine bestimmte Art von Objekten die Ausprägung eines Merkmals vorherzusagen. Das betreffende Merkmal nennt man Zielmerkmal.
Überwachtes maschinelles Lernen (engl.: supervised learning) Überwachtes maschinelles Lernen wird angewandt, um Entscheidungsmodelle zu erstellen, die für eine bestimmte Art von Objekten vorhersagen über ein Zielmerkmal treffen zu können. (z.B. Klassifizieren von Lebensmitteln als “eher empfehlenswert” und “eher nicht empfehlenswert”). Damit das überwachte Lernen angewandt werden kann, benötigt man zuerst digitale Repräsentationen von Objekten, worin die Objekte anhand bestimmer (Prädiktor-)Merkmale beschrieben sind (z. B. Lebensmittel, die durch Nährwertangaben repräsentiert sind). Zusätzlich müssen für alle Objekte die gewünschten Ausprägungen des Zielmerkmals (z.B. eher empfehlenswert/eher nicht empfehlenswert) bekannt sein. Eine Sammlung von Beispielobjekten, denen Werte von Prädiktormerkmalen und Labeln zugeordnet werden, werden so zu einem Satz von Daten, der modellhaft eine ganze Klasse an Objekten repräsentiert. Mit diesen Daten können mit Hilfe von Lernalgorithmen verschiedene Arten von Regelsystemen/Entscheidungsmodellen (z.B. Entscheidungsbaum, neuronales Netz) erstellt werden. Den Erstellungprozess nennt man auch “Lernprozess” oder “Trainingsprozess” und die Daten, die dafür genutzt werden, nennt man Trainingsdaten. Das Verarbeiten der Daten in diesem gesamten Trainingsprozess kann man als “überwachtes maschinelles Lernen” bezeichnen und dabei wird das Regelsystem immer besser an die vorliegenden Daten angepasst, bis am Ende möglichst wenig Fehler bei der Zuordnung (Fehlklassifikationen) passieren. Im ersten Schritt wird ein Entscheidungsmodell also so trainiert, dass es die Trainingsdaten korrekt zuordnet. Zielstellung ist es aber eigentlich, dass das Entscheidungsmodell über die Trainingsdaten hinaus funktioniert und auch neue Objekte (z.B. neue Lebensmittel) korrekt zuordnet. Im Anschluss wird das Entscheidungsmodell mit neuen Objekten bzw. Daten getestet und evaluiert. Dann spricht man von Testdaten. Der Begriff „überwacht“ wird in diesem Zusammenhang genutzt, da für alle verwendeten Objekte in den Daten die Ausprägung des Zielmerkmals bekannt ist und daher genau überwacht werden kann, wie gut des erstellte Entscheidungsmodell für die Daten funktioniert. Ein solches gut funktionierendes Entscheidungsmodell kann man als KI bezeichnen.
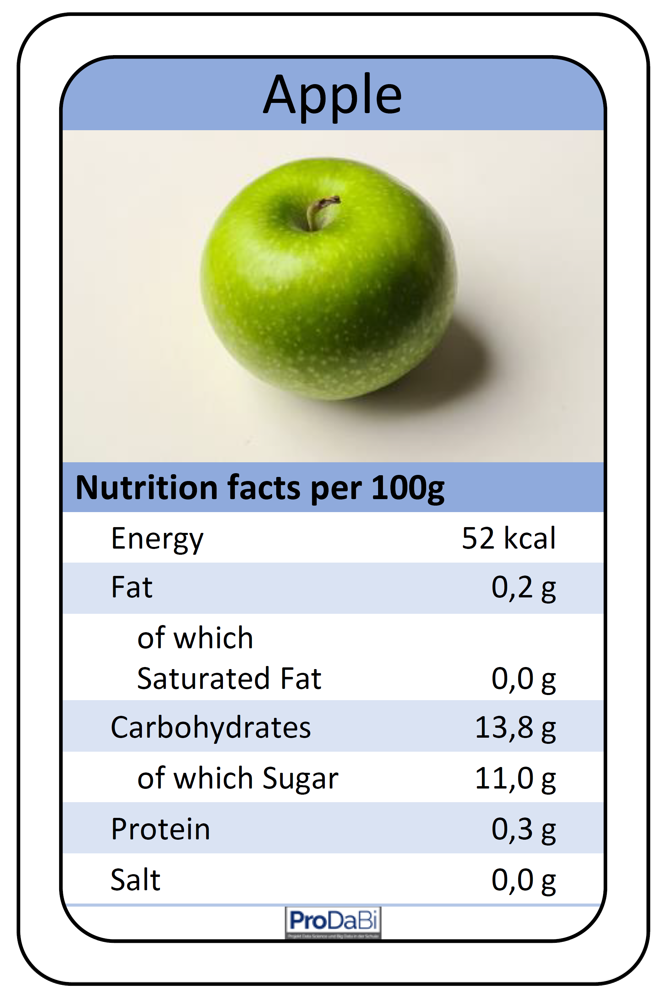
Food data represented as data cards
In the teaching unit, 55 data cards are used, each containing the typical seven nutritional values of a food item, as illustrated in Fig. 1 for an apple. The representation of food data on data cards, as in Fig. 1, and the subsequent work with data, connects for example to the topic of stochastics in the curriculum of North Rhine-Westphalia for lower secondary level (grades 5 and 6). From the very beginning, however, “multivariate” data – data with multiple attributes – are considered, which has long been emphasized in statistics education proposals as an essential component of statistical literacy. Similar connections can also be found in other curricula.
Using the data cards on food items, the teaching is guided by the following key question:
- How can we, using the data cards, construct a recommendation system that classifies a food item, on the basis of its nutritional information, as rather recommendable or rather not recommendable with as few errors as possible?
Such a recommendation system is called a classifier, since individual objects (here: food items) are assigned to a class (“rather recommendable” or “rather not recommendable”) based on their characteristics (nutritional information), i.e. they are classified. The binary variable recommendation is referred to as the target variable, while the numerical nutritional variables are referred to as predictor variables.
Such a classifier is developed on the basis of a set of objects for which both the values of the predictor variables and of the target variable are known. These are the so-called training data. The ultimate goal, however, is that the recommendation also works for new objects. First, the system is tested with test data that were not involved in the training process but for which the values of the target variable are known. This makes it possible to estimate the probability with which the system classifies new objects with an unknown value correctly.
The data example consists of 40 blue cards for creating the recommendation system and 15 yellow cards for testing. Red and green paperclips are used in class to represent the agreed value of the target variable (also called the label).
A decision tree as a classifier
In the following, teachers are introduced to what a decision tree is and how such a tree can be constructed from data using data cards. The didactical implementation in the classroom will be addressed at a later point. A decision tree is a hierarchical system of rules that can be used as a classifier. An example of a decision tree for the previously described context is shown in Fig. 2. This rule system can, for instance, be used to classify the apple from Fig. 1 by traversing the decision tree from top to bottom and, depending on the values of the attributes fat and energy, following the corresponding branches. The first decision node checks the attribute fat. Since the apple contains less than 8 g of fat per 100 g, one takes the left branch and directly arrives at a terminal node (also called a leaf node) of the decision tree. A terminal node is always labeled with a value of the target attribute, which is then assigned to the object being classified. Accordingly, the apple is classified as “rather recommendable.” For a food item with a fat value greater than 8 g, however, one would need to take the right branch and, in a second step, also consider the energy value in order to arrive at a terminal node.
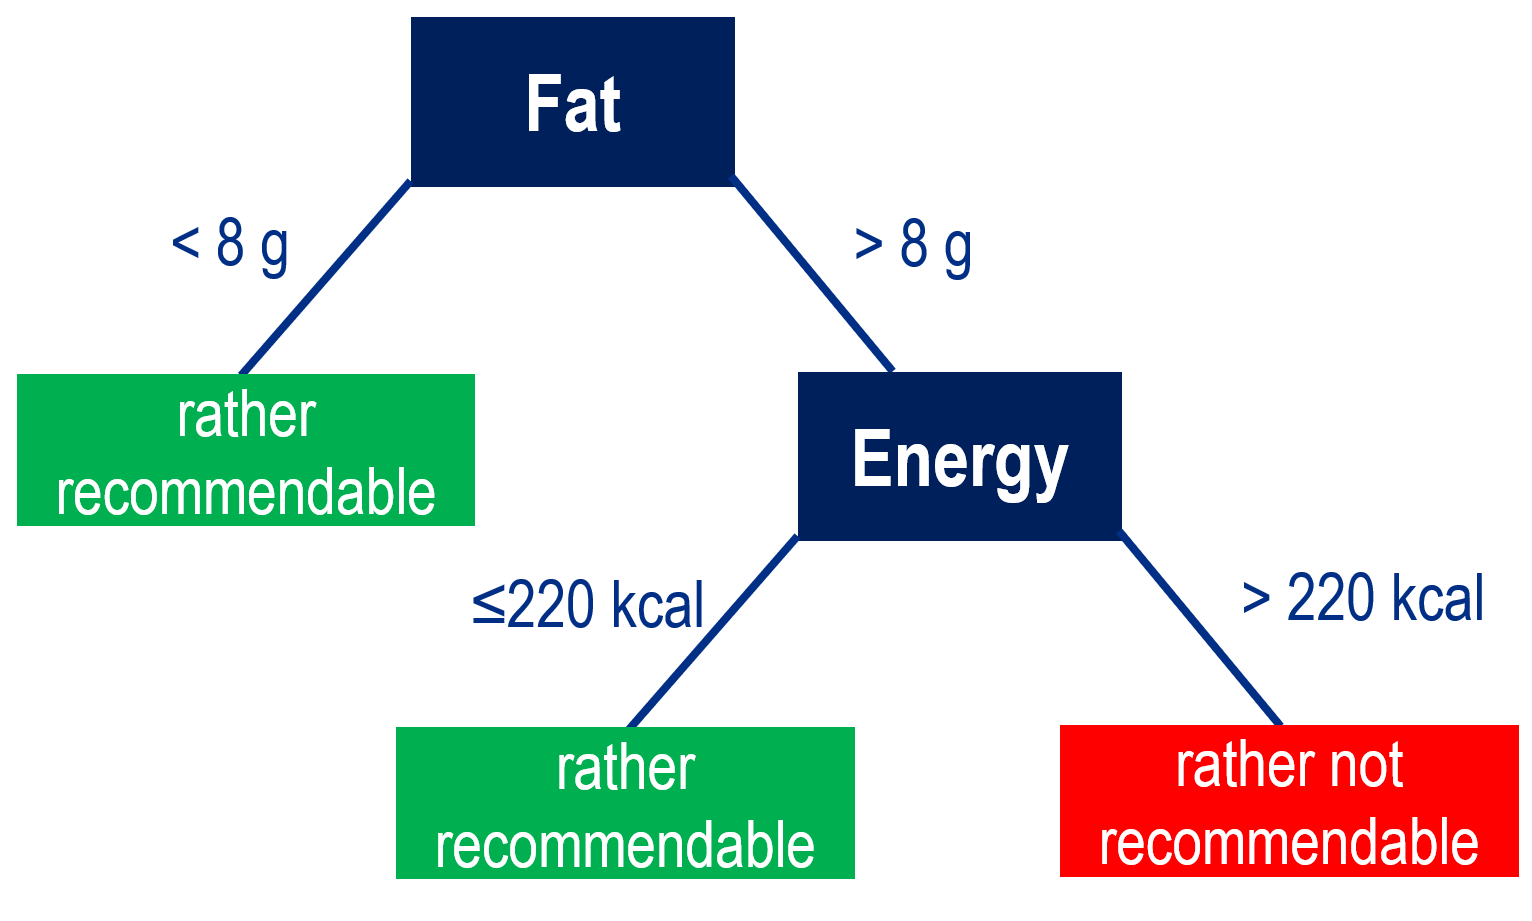
This decision tree is merely an example and does not claim to classify food items in a meaningful way. In principle, such a decision tree can contain any number of levels and predictor variables. The aim of the teaching unit is that students create such a decision tree themselves on the basis of data and understand how computers can be set up to automatically generate decision trees from data (machine learning as part of AI).
Construct a data-based decision tree
A prerequisite for data-based construction of decision trees is the availability of a dataset consisting of a set of example objects for which the values of both the target variable and the predictor variables are known. In the following (Figures 3 and 4), we consider eleven food items as example objects, with their nutritional information specified on each card. These represent the values of the predictor variables such as fat, energy, etc. Furthermore, a green (or red) clip symbolizes whether the food item is classified as rather recommendable (or rather not recommendable), representing the value of the target variable. Based on such a dataset, a decision tree can be built step by step with the aim of classifying the training data with as few errors as possible.
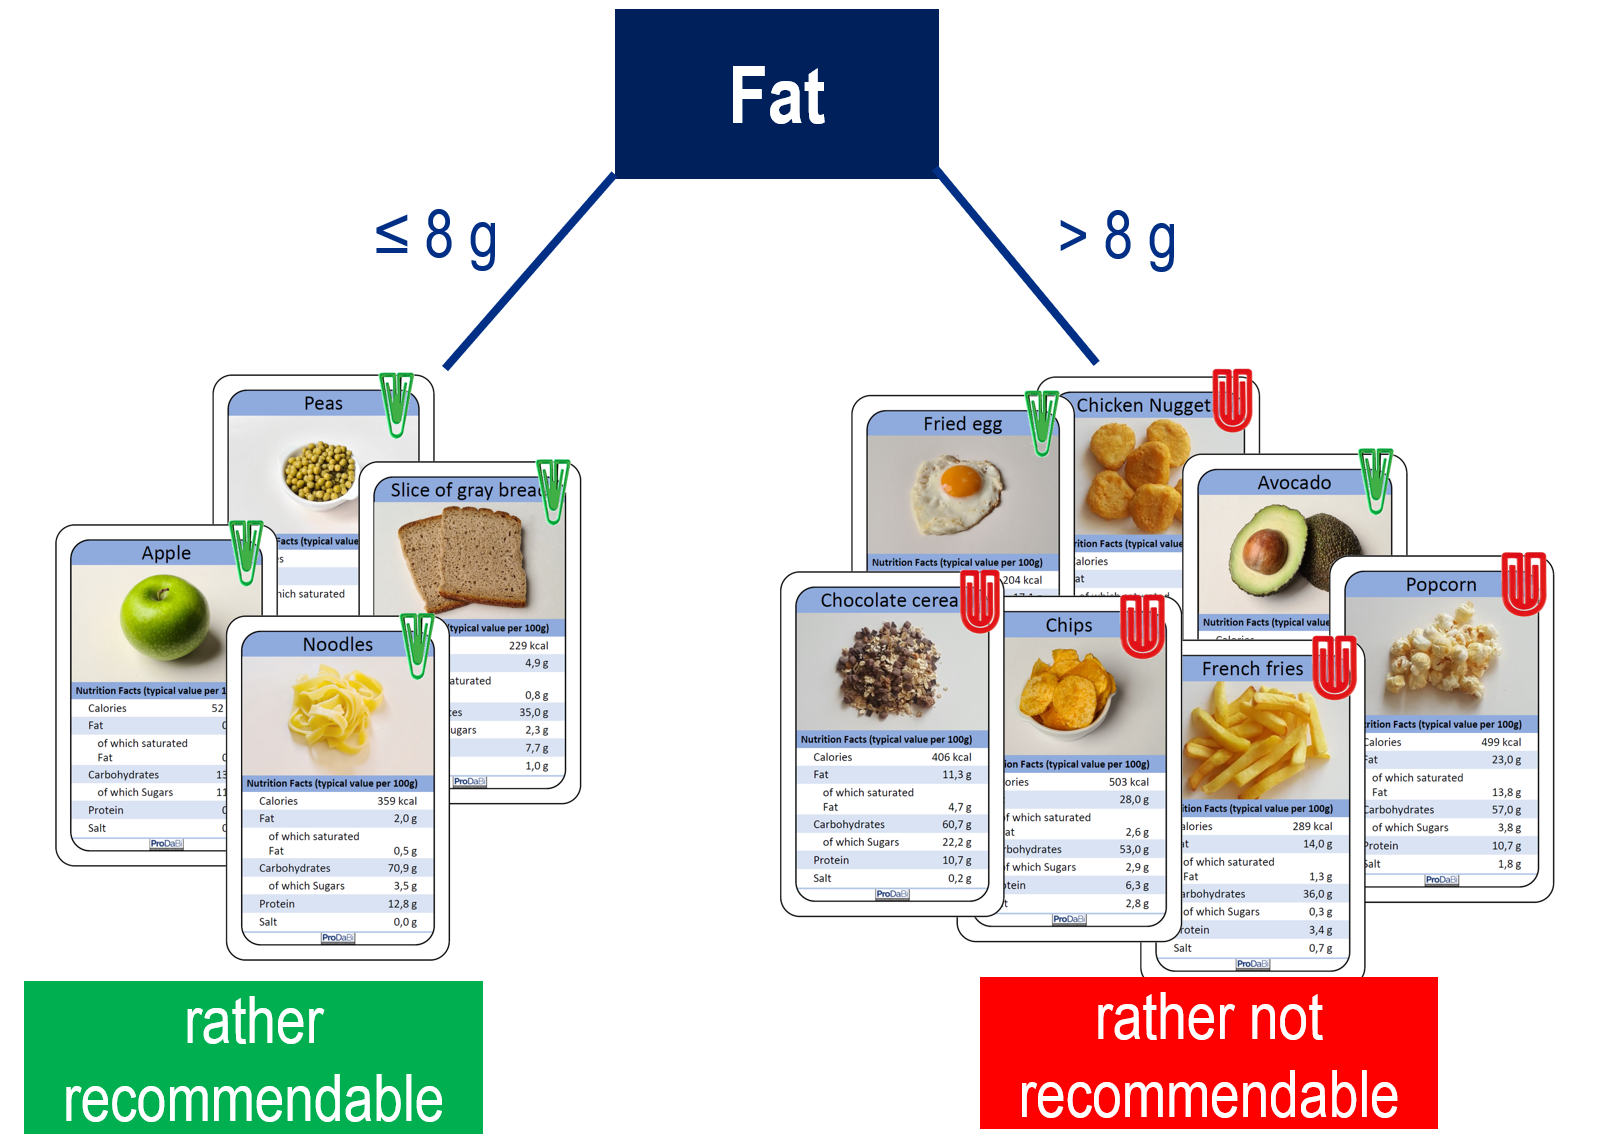
The basis for constructing the decision tree is the so-called data split. That is, using one predictor variable and a threshold value, the dataset is divided into two subsets (Component 1). In Figure 3, we see a data split with the variable fat and the threshold of 8 g, meaning that all food items with more than 8 g of fat are on the right side, and those with up to 8 g of fat are on the left. In each subset, a majority decision regarding the target variable is then made (Component 2). In our example, the left subset contains only rather recommendable food items, while in the right subset the majority of items are rather not recommendable. The resulting decision rule (if ≤ 8 g fat, then rather recommendable; if > 8 g fat, then rather not recommendable) can be evaluated (Component 3) by determining the number of food items misclassified in the dataset (misclassifications). In our example, two food items are misclassified, namely avocado and fried egg on the right-hand side. When constructing a decision tree, data splits are chosen in such a way that these majority decisions produce as few misclassifications as possible. Finally, the resulting one-level decision tree can be represented (Component 4). This can be done verbally or by means of a typical tree diagram. In the representation of the decision tree, the data cards no longer appear. Instead of the cards (cf. Fig. 3), however, the distribution of the target variable in both subsets (4 to 0; 2 to 5) should be noted, so that the number of misclassifications remains transparent.
The one-level decision tree developed so far, which misclassifies two food items, can now be further improved by adding another level. The data cards in the left branch can be set aside, since everything there is already correctly classified. With the cards in the right branch, the procedure is the same as described for the first level. If the predictor variable energy and the threshold of 220 kcal are used for another data split, the resulting decision tree (see Fig. 2) correctly classifies all food items in this dataset.
A central aspect that has not yet been explained is how a variable and a threshold are selected for the first data split and for the subsequent ones in a “favorable” way—i.e., such that as few misclassifications as possible occur. With the data cards, this can be carried out by sorting and systematic trial and error.
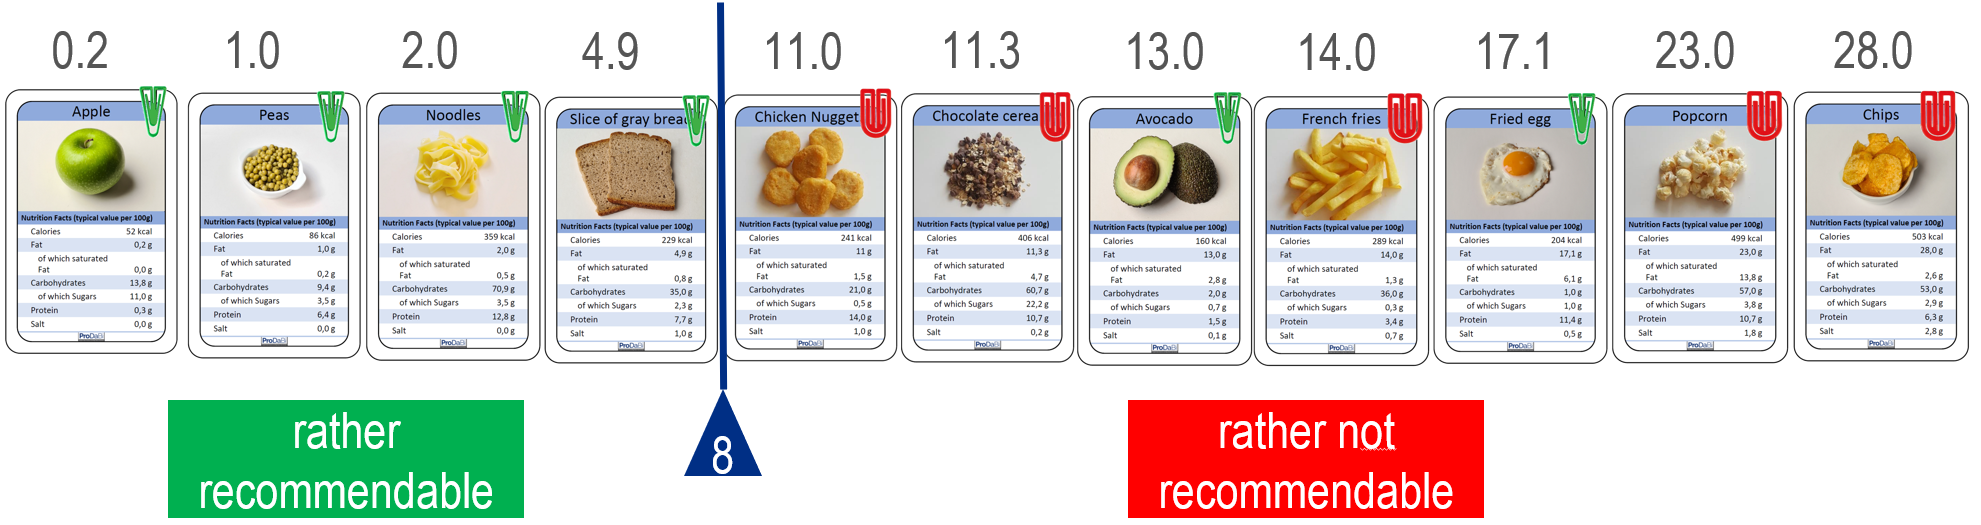
Starting from the sorted data cards, different possible data splits and the resulting number of misclassifications can be compared. For a given dataset, we consider the split to be optimal that produces the smallest number of misclassified objects. In this example, the optimal split is the one visualized in Fig. 4, between the slice of wholemeal bread and the chicken nuggets. This can be verified by systematically examining all possible data splits. To do so, the separating vertical line is shifted step by step into each gap between two cards, and Components 1–3 (as explained earlier) are applied in each case to determine the number of misclassified objects. For example, a split between avocado and French fries results in three misclassified objects and is therefore to be rated as less favorable.
Once an optimal data split has been selected (in our example with two misclassified objects), a threshold can be chosen within the interval between the fat values of the two adjacent cards. In Fig. 4, the value 8 was chosen as the threshold within the interval between 4.9 and 11.0. For all other predictor variables, an optimal split can likewise be determined, after which the predictor variable is selected that yields the smallest possible number of misclassified food items. This means that a so-called greedy strategy is applied: one first searches for the best one-level decision tree, and only then considers the second level and decides whether further splits are required. At each stage, the best variable with its optimal split in the respective subset of the data is selected. It is essentially this systematic method that is implemented in professional decision tree algorithms. These also include suitable stopping criteria. In classroom practice, however, examining all possible splits is very laborious for students, so (initially) somewhat simplified strategies can be applied, which will be explained in the next section. These strategies follow the same approach and can therefore provide a foundation for understanding how a machine proceeds automatically, exhaustively, and systematically.
Materials
Download of all materials
Hier können Sie alle Arbeitsblätter, Hilfszettel und Hinweisblätter als komprimierten Ordner herunterladen:
Eine Druckvorlage für die Datenkarten finden Sie hier:
Eine Druckvorlage für die Datenkarten in englischer Sprache finden Sie hier:
Zwei Klassensätze der Datenkarten können Sie hier bestellen:
Eine Version des Materials in türkischer Sprache finden Sie hier.
The worksheets were translated from both German and English into Turkish using DeepL by Merve Dede (dedemervee@gmail.com), reviewed by Oguz Koklu (kokluoguz@gmail.com), and used with permission from the ProBaBi Project Team.
Zum Teil 1: Aufbau und Funktionsweise des Mobilfunknetzes
- Download: Folien Gedankenexperiment (für Phase 1a)
- Link: Erklärvideo zum Mobilfunknetz (Phase 1b)
- Download: Druckvorlage für das Puzzle (für Phase 1b)
- Download: Arbeitsblatt 1 (für Phase 1b)
- Download: Arbeitsblatt 2 für Niveaustufe 1 (für Phase 1b)
- Download: Arbeitsblatt 2 für Niveaustufe 2 (für Phase 1b)
- Download: Sprinteraufgabe für Arbeitsblatt 2 (für Phase 1b)
- Download: Arbeitsblatt 3 (für Phase 1b)
Zum Teil 3: Exploration gegebener Standortdaten
Further information
Learning path for pupils - decision trees with data cards
The learning path “Decide like an AI” was created in cooperation between ProDaBi and inf-schule.de. It offers a supplement to the food data cards developed in ProDaBi and the corresponding series of lessons on decision trees.
The learning path is prepared for pupils and has the following introductory text: “In this learning path, you are to create an artificial intelligence (AI) that decides whether a food is recommended or not recommended based on its nutritional values. You will train your AI yourself with selected foods in order to have a decision-making aid for other foods afterwards.”
Links:
Informationen über Maschinelles Lernen
Maschinelles Lernen ist ein weiter Bereich, der verschiedene Methoden und Lernalgorithmen für das automatische Lösen unterschiedlichsterer Aufgabentypen umfasst. Das verbindende Element zwischen allen Methoden die zum maschinelle Lernen gehören ist, dass sie auf Trainingsdaten beruhen. Wir konzentrieren uns auf die Unterart des überwachten Lernens, insbesondere auf Klassifikationsaufgaben, die mit Entscheidungsbäumen gelöst werden können.
Bei der Klassifikation geht es darum, Objekte oder Individuen einer Population mit (idealerweise) korrekten Labels in Bezug auf eine bestimmte Fragestellung zu versehen. In der Statistik ist eine Population eine Menge von ähnlichen Individuen, Objekten oder Ereignissen, die für eine bestimmte Frage oder statistische Untersuchung von Interesse sind. Typische Beispiele für Klassifikationsaufgaben sind die Zuordnung eines Patienten (Individuum) zu einer Diagnose (Etikett) oder die KLassifikation von E-Mails als “Spam” oder “kein Spam”. Die möglichen Labels stammen aus einer Label-Menge, je nachdem, ob man von einem binären Klassifikationsproblem (zwei mögliche Labels) oder einem Multiklassen-Klassifikationsproblem (eine endliche Menge von mehr als zwei Labels) spricht.
Die Aufgabe eines Lernalgorithmus besteht darin, einen Klassifikator zu erstellen, der für jedes beliebige Objekt in der Population ein Label vorhersagt. Um eine fundierte Vorhersage zu treffen, wird ein Objekt durch eine Reihe von Merkmalen repräsentiert, die als Vektor dargestellt werden. Da die Merkmale die Wahl des vorhergesagten Labels beeinflussen, werden sie als Prädiktorvariablen bezeichnet. Die Labels sind die Werte einer so genannten Zielvariable. Die Erstellung eines Klassifikators basiert auf Trainingsbeispielen, d. h. auf Objekten aus der Grundgesamtheit, von denen die Werte der Prädiktorvariablen und die korrekten Labels bekannt sind. Ein Satz von Trainingsbeispielen wird als Trainingsdaten bezeichnet. Als Maß für den Erfolg wird in der Praxis anhand von Testdaten die Fehlklassifikationsrate berechnet. Die Testdaten sind strukturell identisch mit den Trainingsdaten, wurden aber nicht zur Erstellung des Klassifikators verwendet.
Entscheidungsbäume werden algorithmisch aus Daten konstruiert, um als Klassifikatoren zu dienen. Besonders wenn der Baum nicht zu groß ist, macht die Verwendung einer hierarchischen Baumstruktur die Entscheidung sehr transparent und verständlich.
Informationen zum Nutri-Score
Ein Infoblatt zum Nutri-Score und der einfacheren Kategorisierung in der ProDaBi Unterrichtsreihe finden Sie hier: