Project Data Science and Big Data in School (ProDaBi)
We develop, implement and evaluate concepts and materials
on the topics of data science and AI in school.
What is the ProDaBi project about?
Wir wollen Data Science und KI in die Schule bringen, um Schüler*innen zu befähigen,
to handle and use these technologies in a self-determined way.
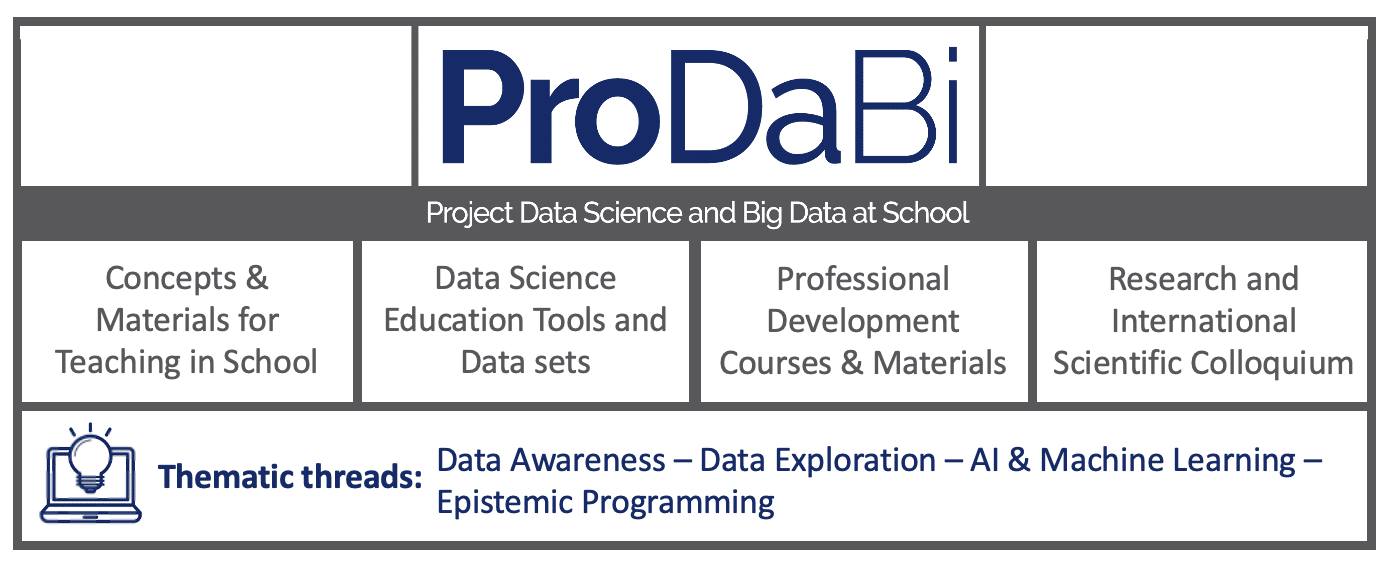
The diagram shows the individual project pillars and subject areas:
What are the tasks and goals that we pursue?
What should education on data science, big data
and AI look like in the future?
News
Professional Development
New training course "Data detectives at work" starts on 13.12.2023
Der nächste Durchgang der Fortbildung “Datendetekiv*innen bei der Arbeit – Data Science und künstliche Intelligenz (ohne Programmieren)” findet als zweitägige Lehrkräftefortbildung statt am 13.12.2023 und
15. September 2023
Kommende Colloquiumssessions
Session 19 - Part 1: David Touretzky (USA)
What Does 'Play' Look Like When Your Toys Are Smarter Than You?
- 09.07.2025
- 16.00-17.15 (UTC+2)
Session 19 - Part 2: David Weintrop (USA)
Situating High School Data Science in the Lives of Students
- 09.07.2025
- 17.15-18.30 (UTC+2)